Scientist Designer: Becoming an Efficient Experimenter in Design
Overview
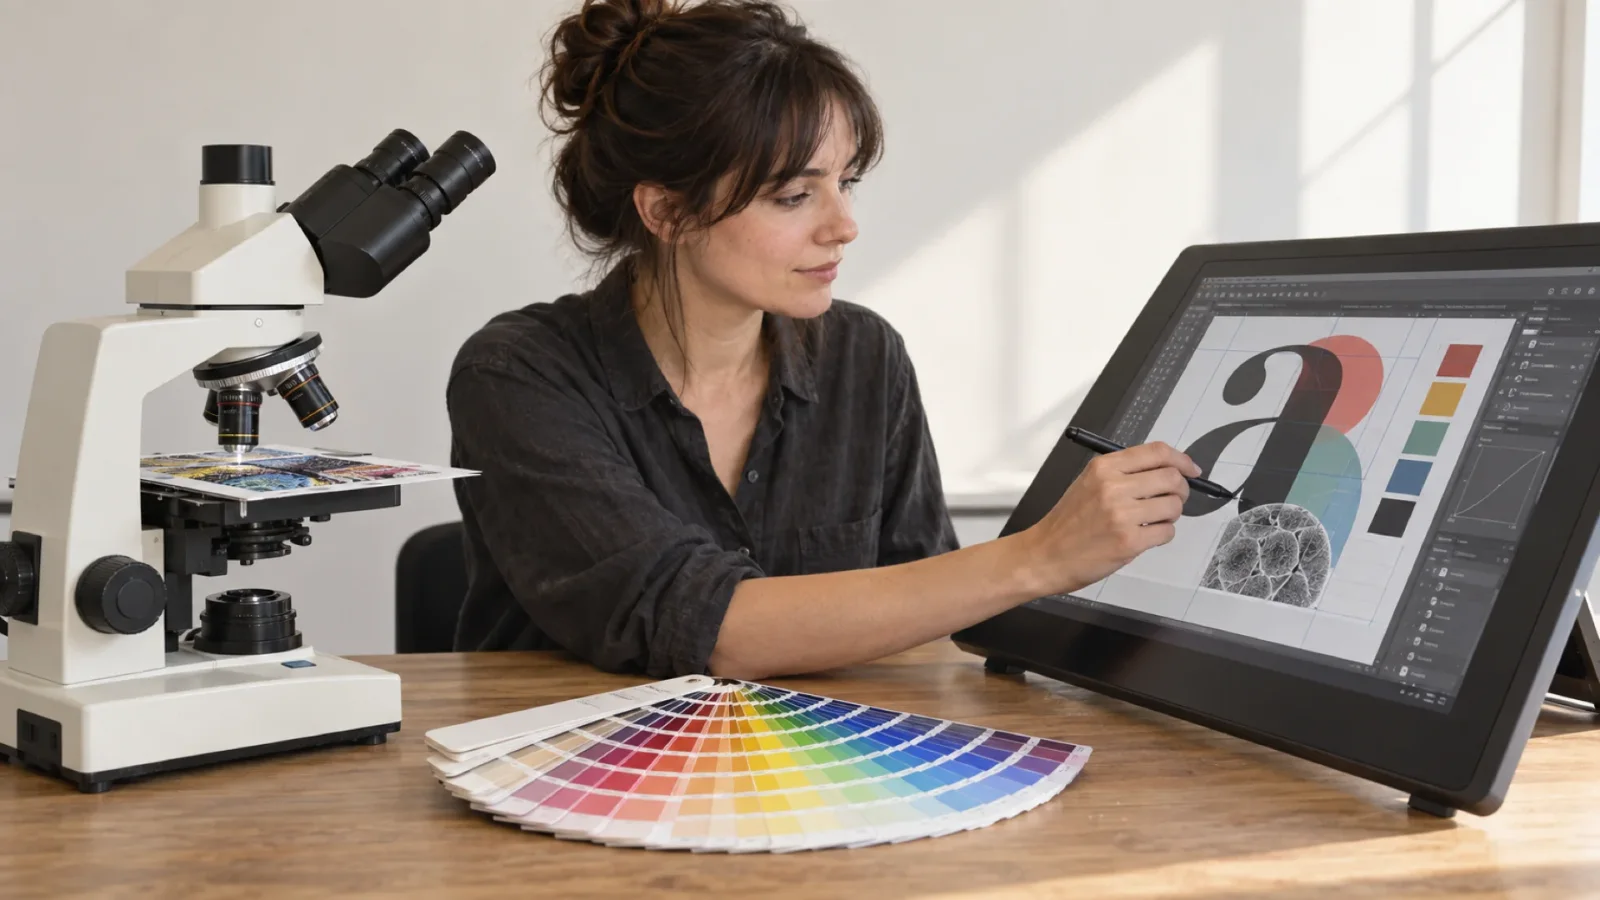
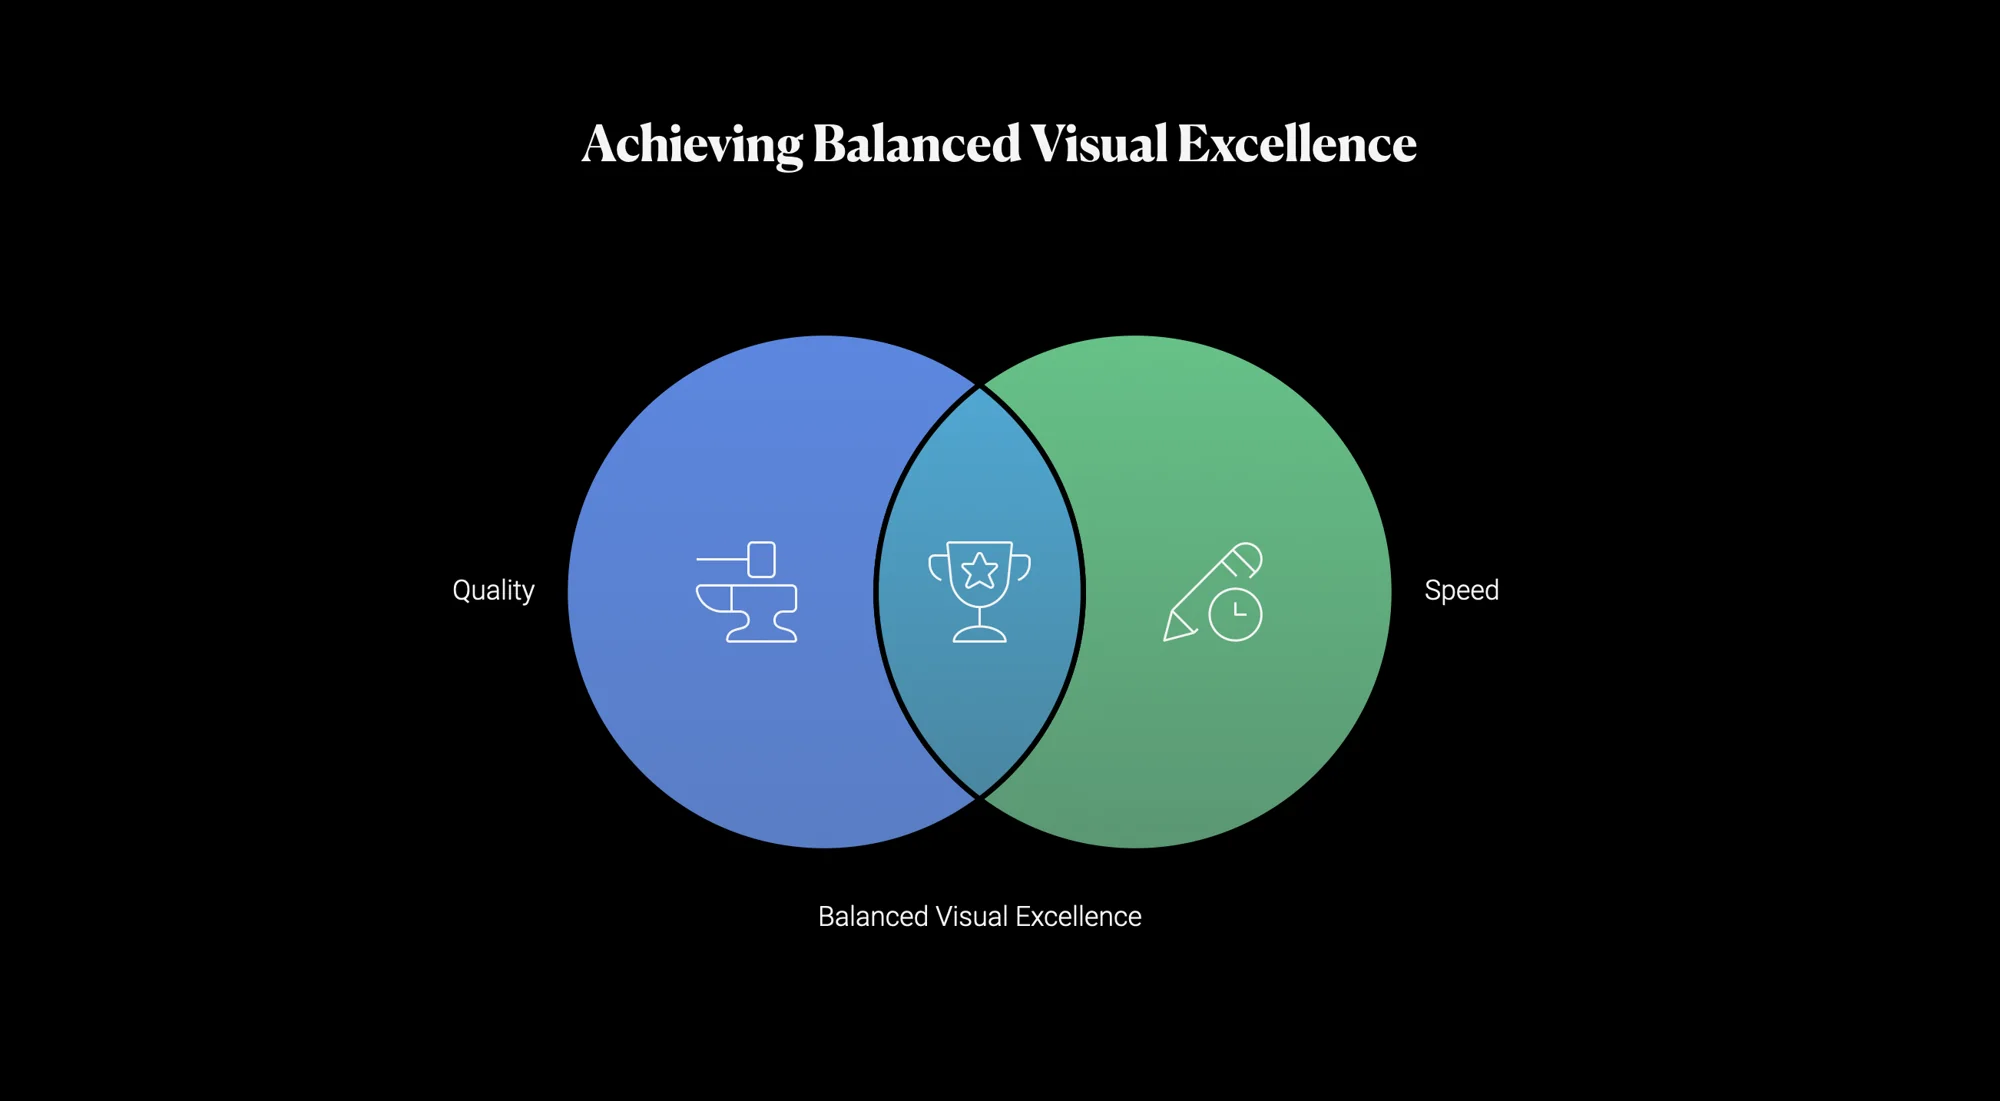
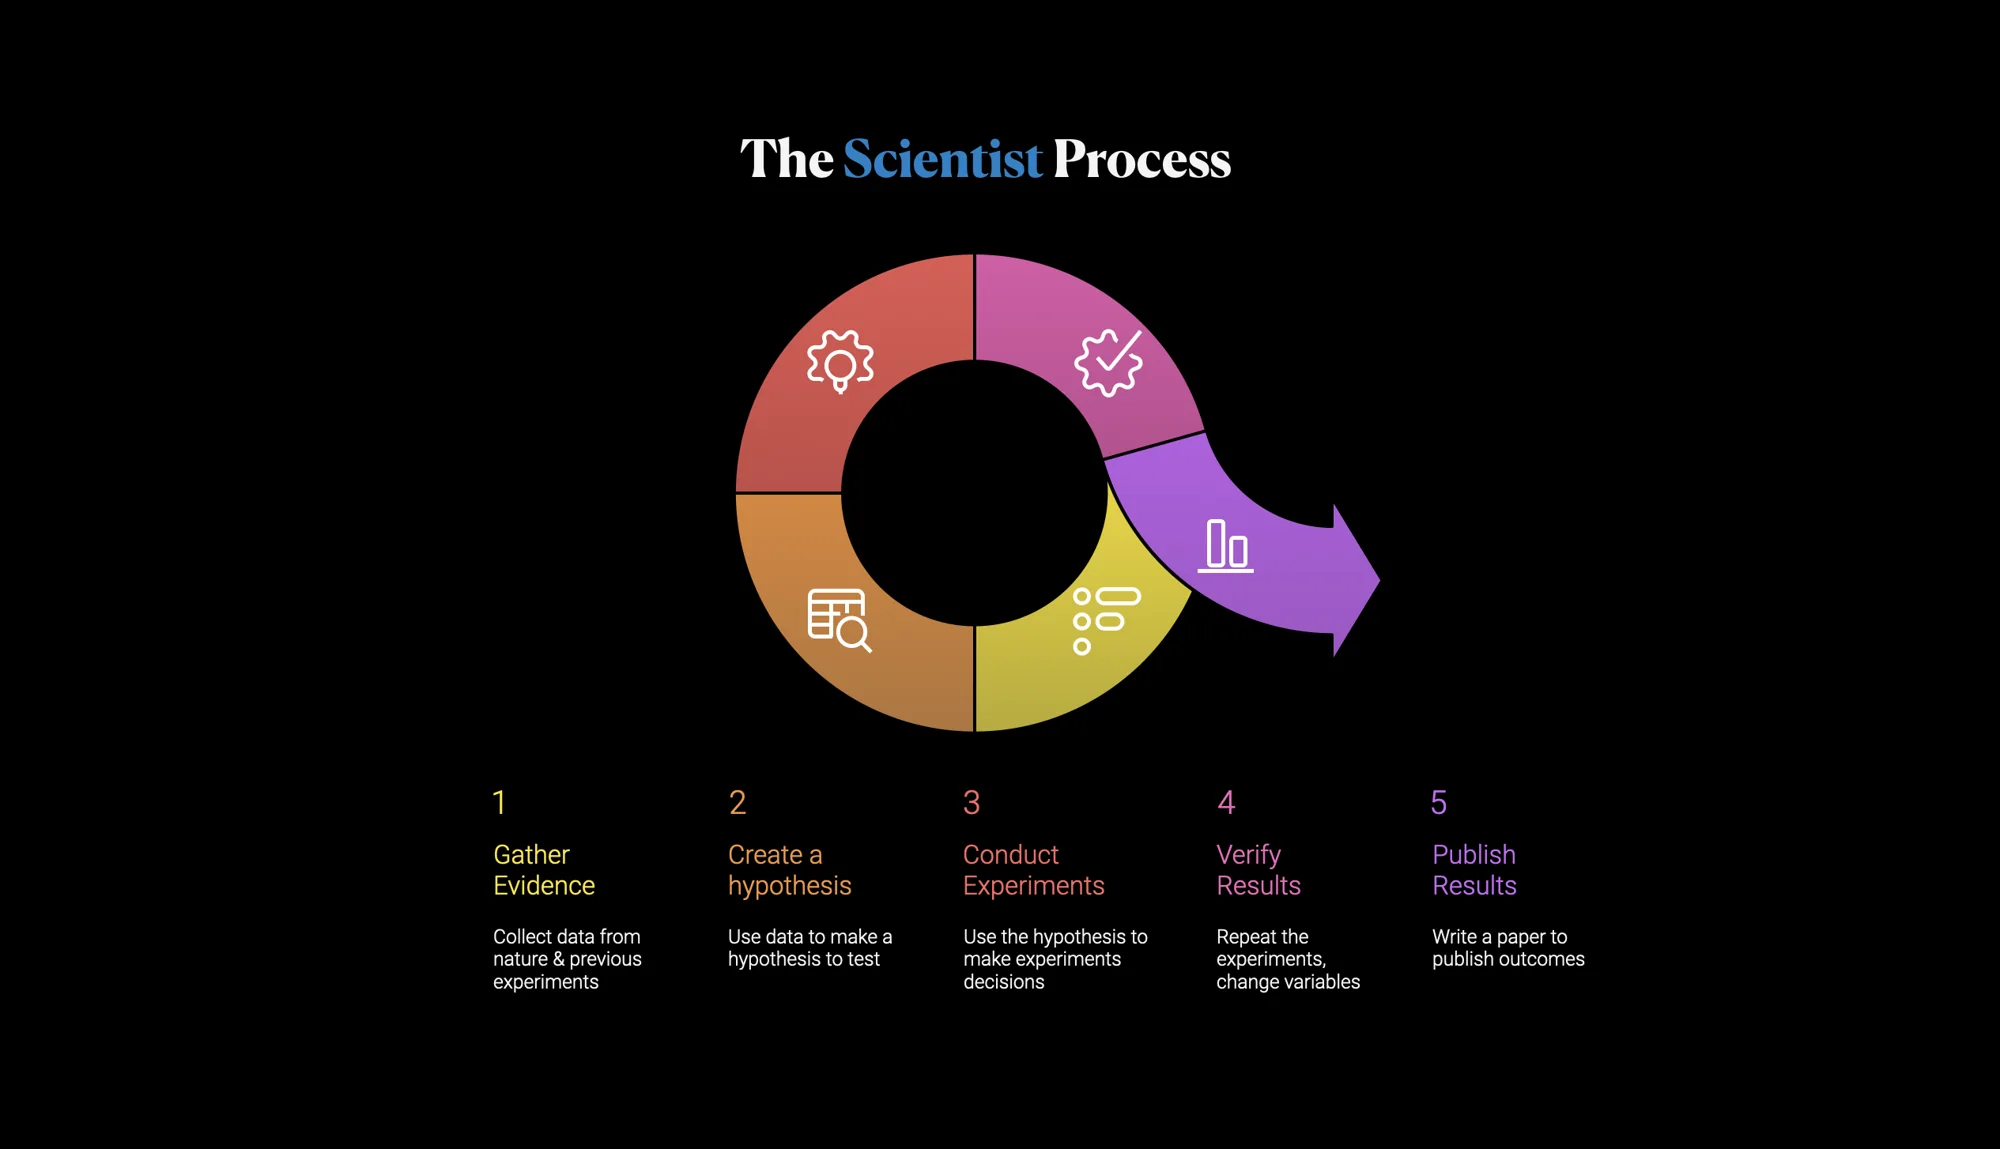
Being a Scientist Designer means applying a scientific mindset to your design work. Rather than relying solely on imagination or static intuition, you iterate through quick experiments, gather evidence, and refine ideas efficiently. Research on iterative design and rapid prototyping shows that creating and testing early versions of a product helps catch issues sooner and reduces costs. Iterative testing focuses on experimenting with small adjustments, analyzing the results and refining based on data. The goal is to balance quality and speed so that you can build strong visual solutions without getting trapped in endless perfectionism.
This guide is organized into modules you can use to build a training session or slide deck. Each module includes background information, key takeaways and suggested activities.
Module 1 – Introduction: Why Designers Need to Think Like Scientists?
Studies show that most new products fail; Google ran more than 600,000 experiments in 2020 and Netflix created a custom testing platform to validate design decisions. Rapid experimentation helps avoid waste because it lets customers decide what gets built.
Assumptions should be challenged; every idea contains hidden beliefs that need validation.
Iterative design vs. traditional design. Traditional workflows finalize a design before prototyping, then produce a single prototype and test it, which can be slow and costly. Iterative design, in contrast, creates an early working design, prototypes it quickly, gathers client feedback and iterates multiple times. This approach increases efficiency, lowers development costs and reduces the need for complete redesigns.
Set expectations for the session. Being scientific doesn’t remove creativity. Instead, it provides structure so that experimentation is faster, evidence-based and playful. Designers should come away ready to test ideas quickly, make informed adjustments and remain open to unexpected solutions.
Module 2 – Rapid Testing Method (RTM)
2.1 Testing Color Choices Quickly
Understand color theory basics. Color theory provides a framework for choosing and communicating color in design. Modern color wheels show relationships between primary, secondary and tertiary colors. Hue, shade, tint and tone control variations , while color temperature influences emotional response (warm colors feel exciting, cool colors feel calm) .
Pick a base color and try variants. Don’t spend hours hunting for the “perfect” shade up front. Select a base hue that aligns with your brand message and quickly test variations by adjusting brightness and saturation. Use a color wheel tool to generate complementary, analogous or triadic palettes, then evaluate them on a simple mock‑up.
Start with Pantone when needed. The Pantone Matching System assigns unique codes to standardized shades and provides a universal language of color. Using Pantone colors at the concept stage saves time because the chosen colors can be reproduced accurately in print and textiles. Pantone codes work across media and reduce trial‑and‑error. If a Pantone color works in your test, you already have a production‑ready reference.
Check contrast and accessibility early. Accessibility guidelines require a minimum contrast ratio (4.5:1 for normal text, 3:1 for large text ). Poor contrast makes text unreadable for people with low vision or color blindness. Use tools or convert your design to grayscale to see if elements remain distinguishable .
Iterate through small adjustments. Adopt a halving approach: if the color feels too dark, lighten it by half the difference; if it is too saturated, reduce saturation by half, then fine‑tune. This binary‑search‑style method quickly narrows down the best hue without testing every possible value. Focus on feedback (internal or from clients) rather than chasing perfection.
2.2 Testing Layout Position Efficiently
Use grids and key positions. Grid and alignment are core principles that arrange elements relative to an invisible structure. Starting with familiar anchors–such as the rule of thirds, the golden ratio or central alignment, gives you a baseline. The rule of thirds divides the canvas into nine equal sections; placing key elements along these lines often creates balance.
Apply the halves method for positioning. Instead of creating hundreds of samples, position the element at two extremes (e.g., too far left and too far right). Evaluate which side feels better, then move it halfway towards the other side. Repeat by halving the distance until you find a visually pleasing position. This approach mirrors the efficiency of binary search and quickly converges on an optimal placement.
Consider optical centre and visual weight. The optical centre is slightly above the geometric centre and often feels more balanced to the human eye. Visual weight is the force that an element exerts to attract the eye; larger or more saturated elements carry greater weight. Adjust positions until elements of different weights balance each other.
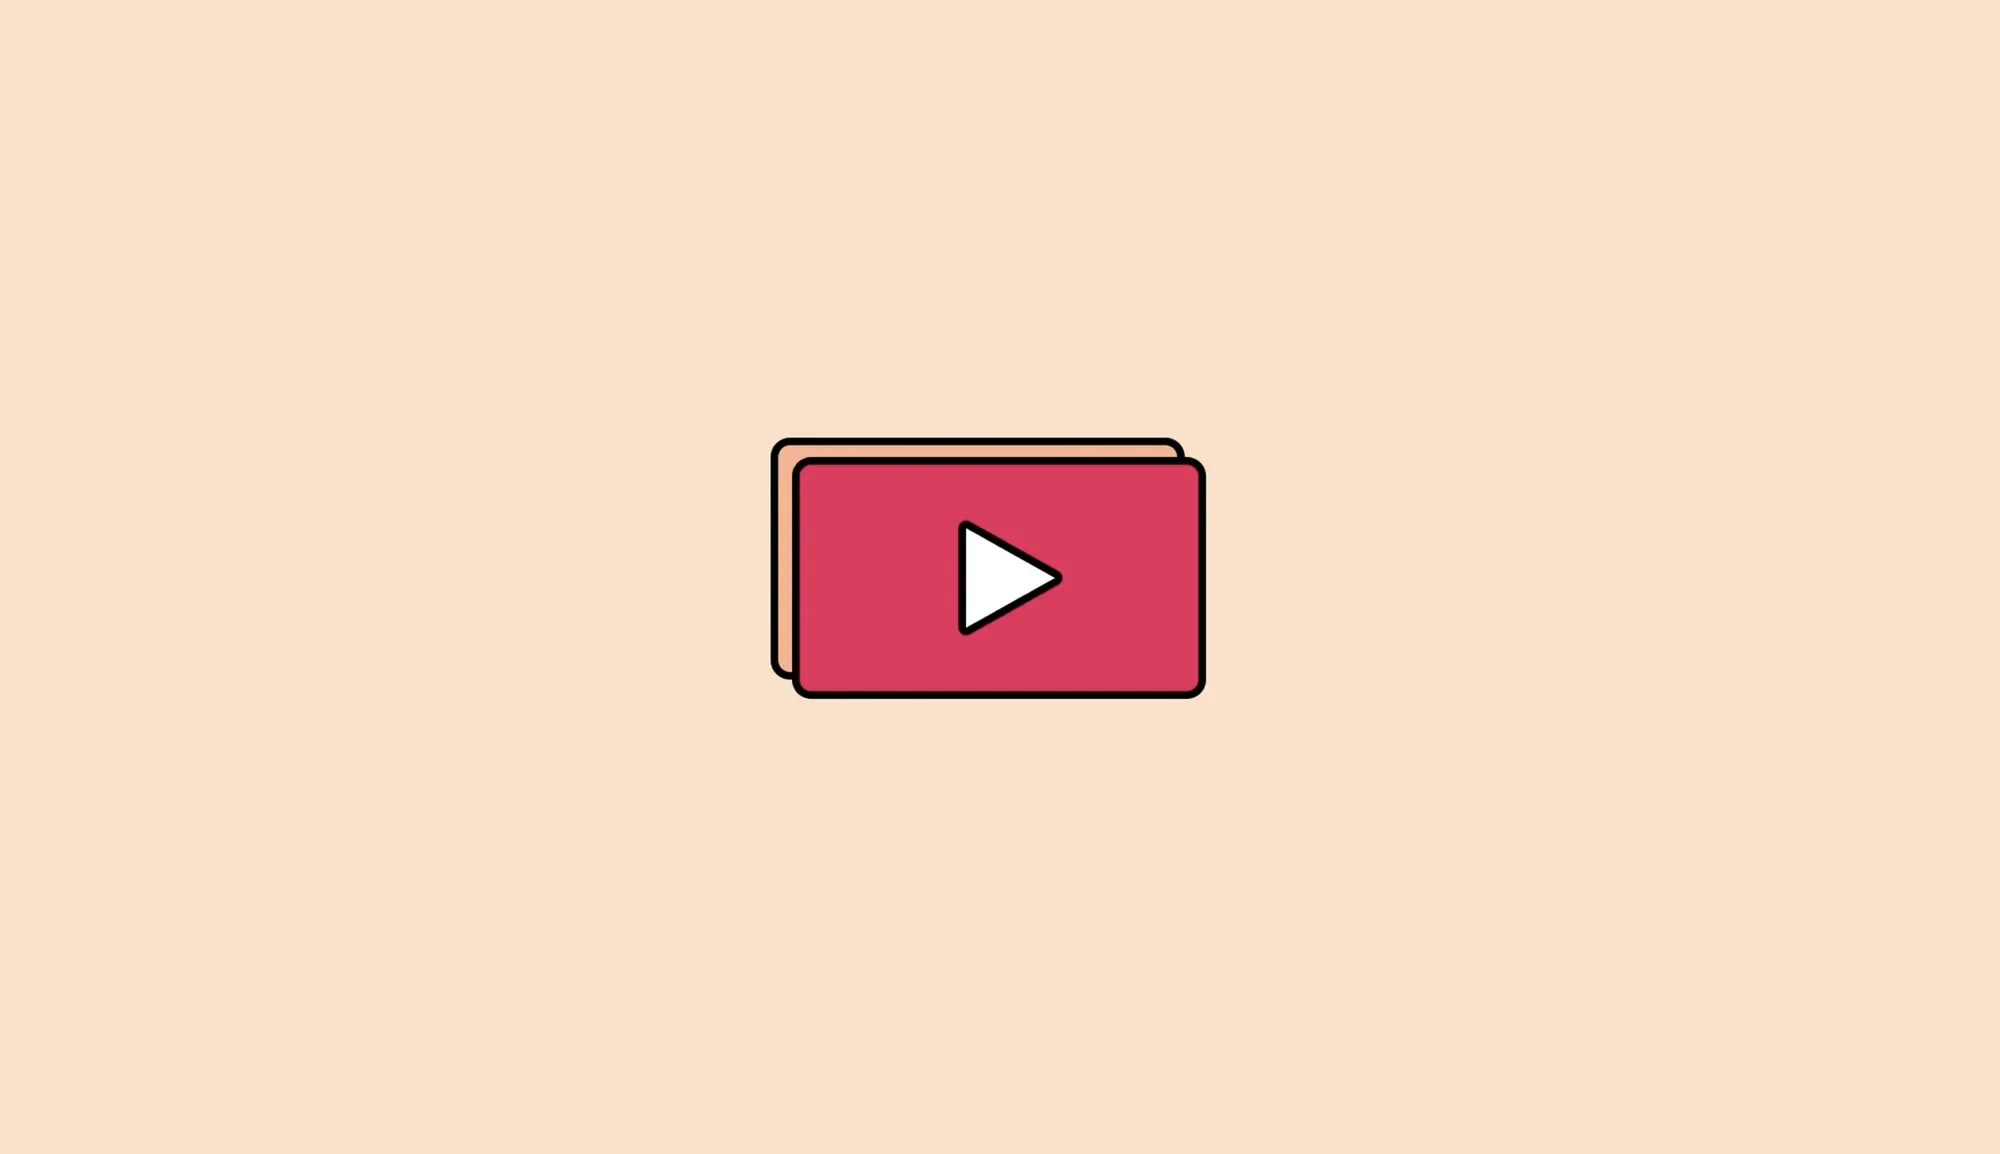
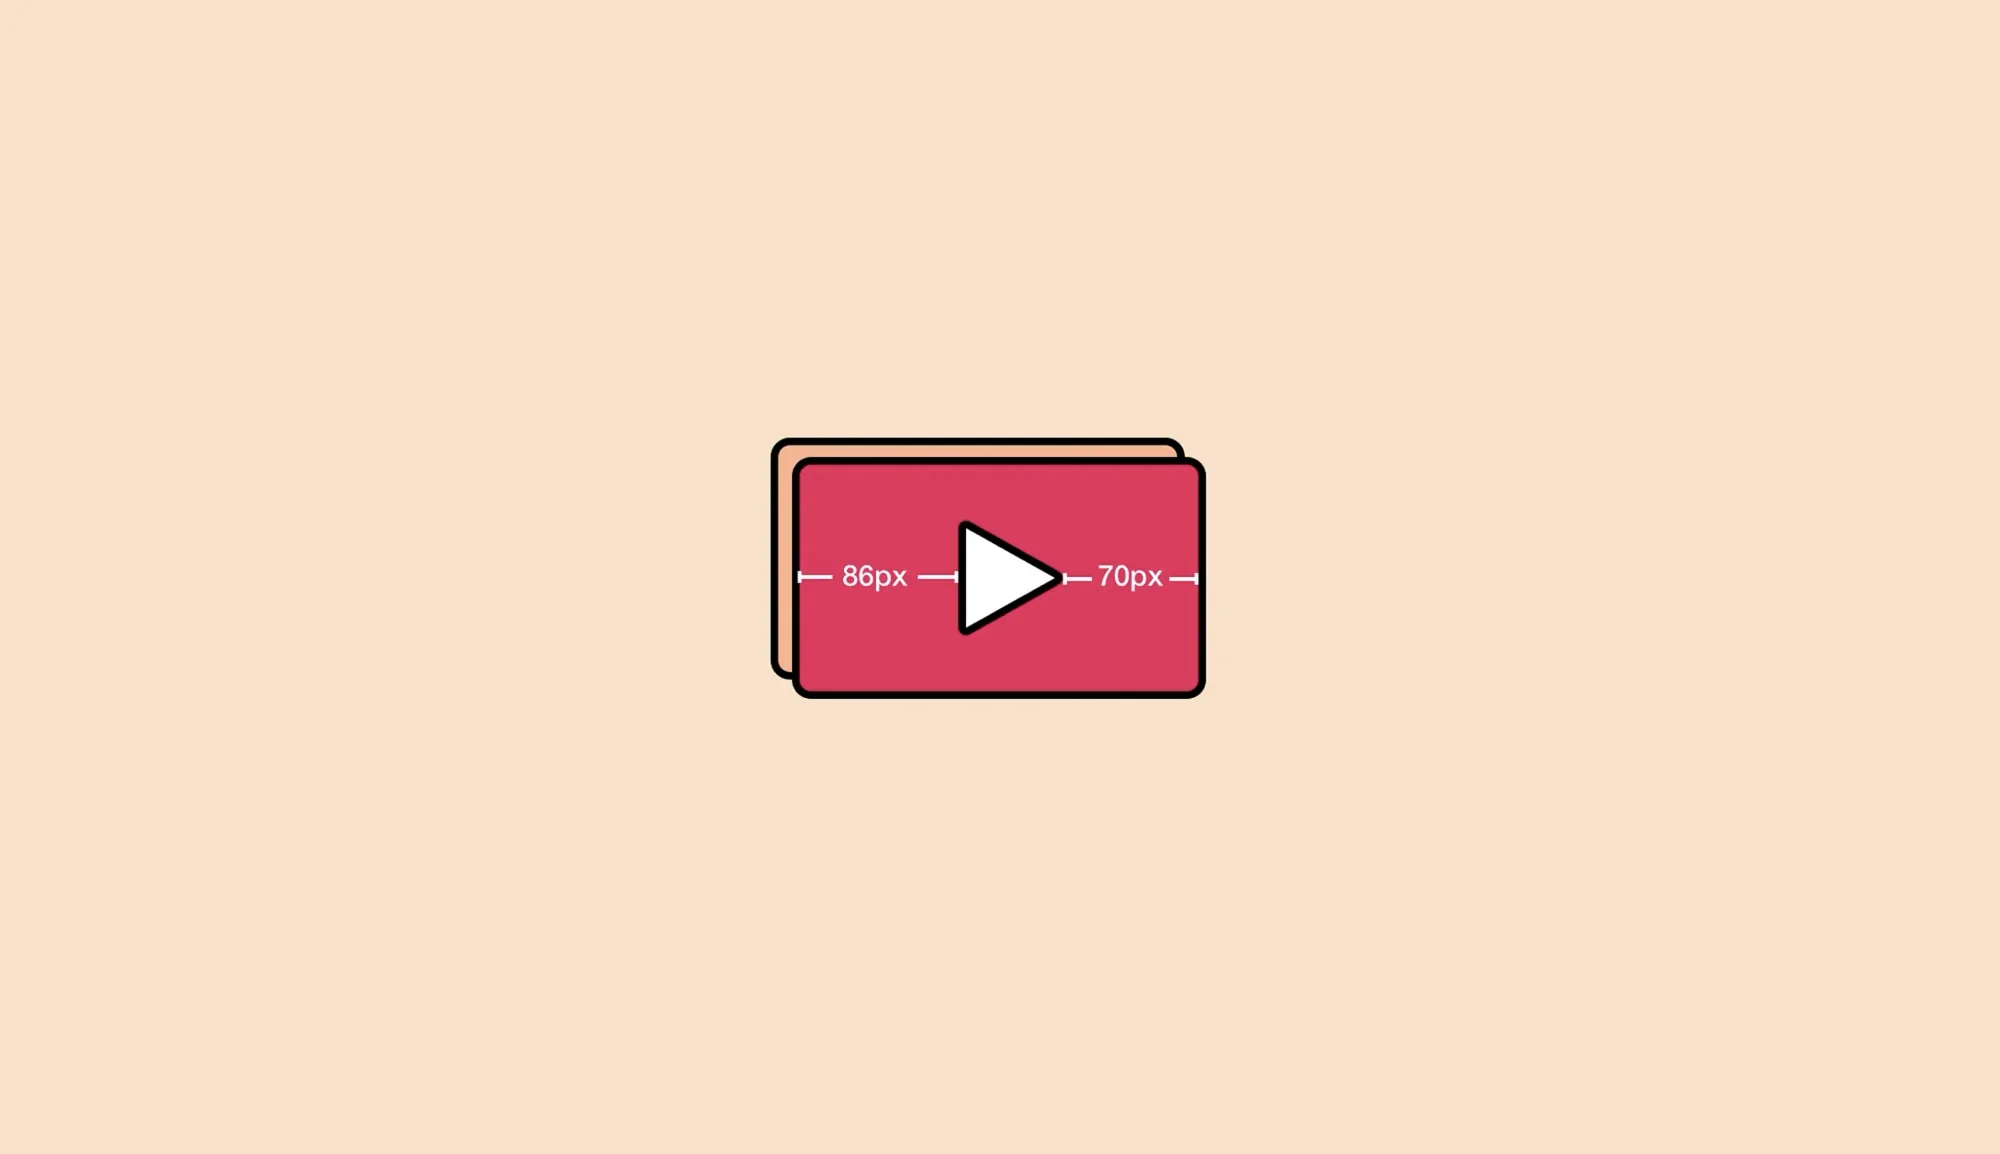
Test alignment optically. Mathematical centering can look off when shapes have unequal visual weights. Align elements optically by nudging them opposite to their heavier side. For example, icons like triangles may need to be shifted to compensate for uneven visual weight .
Prototype at low fidelity. Sketch or wireframe quickly to test different layouts. Rapid prototypes can be paper sketches or simple digital frames; they allow you to experiment without investing time in polished visuals.
2.3 Testing Ideas and Assumptions
Design experiments, not polished solutions. Rapid experiments test the riskiest assumptions through customer behavior. They are intentionally quick and “dirty,” focusing on the data rather than aesthetics. Build prototypes that answer specific questions instead of finalizing details.
Gather feedback quickly. Iterative testing cycles provide data that show what works and what doesn’t. For example, reposition a feature based on audience analytics and observe the change in clicks. Each small test refines your design.
Test multiple variations. A/B testing and design sprints let the team or clients compare alternatives. Use design thinking or lean methods to create multiple low‑fidelity prototypes and evaluate them with real target audience.
Document results and refine. Record which variations performed better and why. Use this evidence to inform the next iteration and avoid repeating mistakes.
Module 3 – Visual Illusions and Optical Adjustments
3.1 Optical Alignment
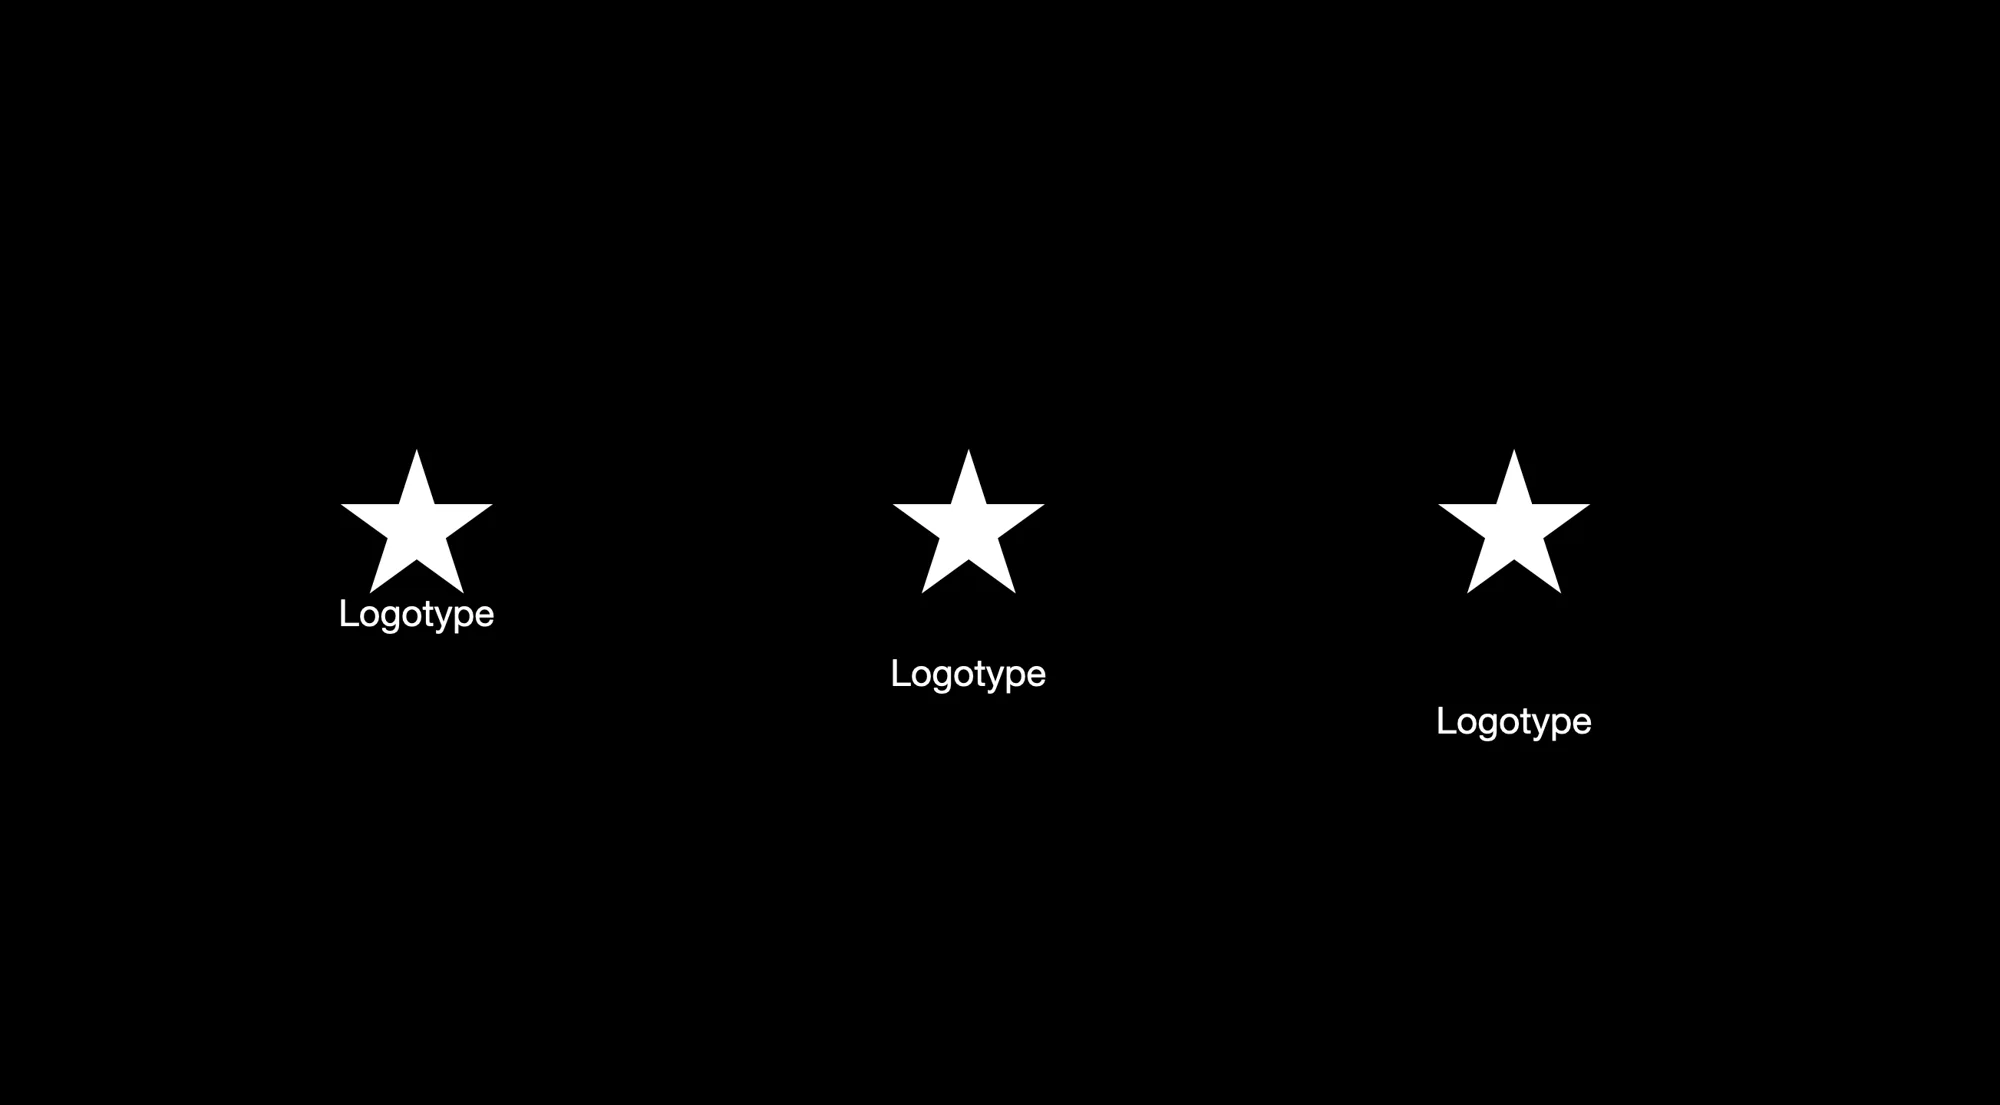
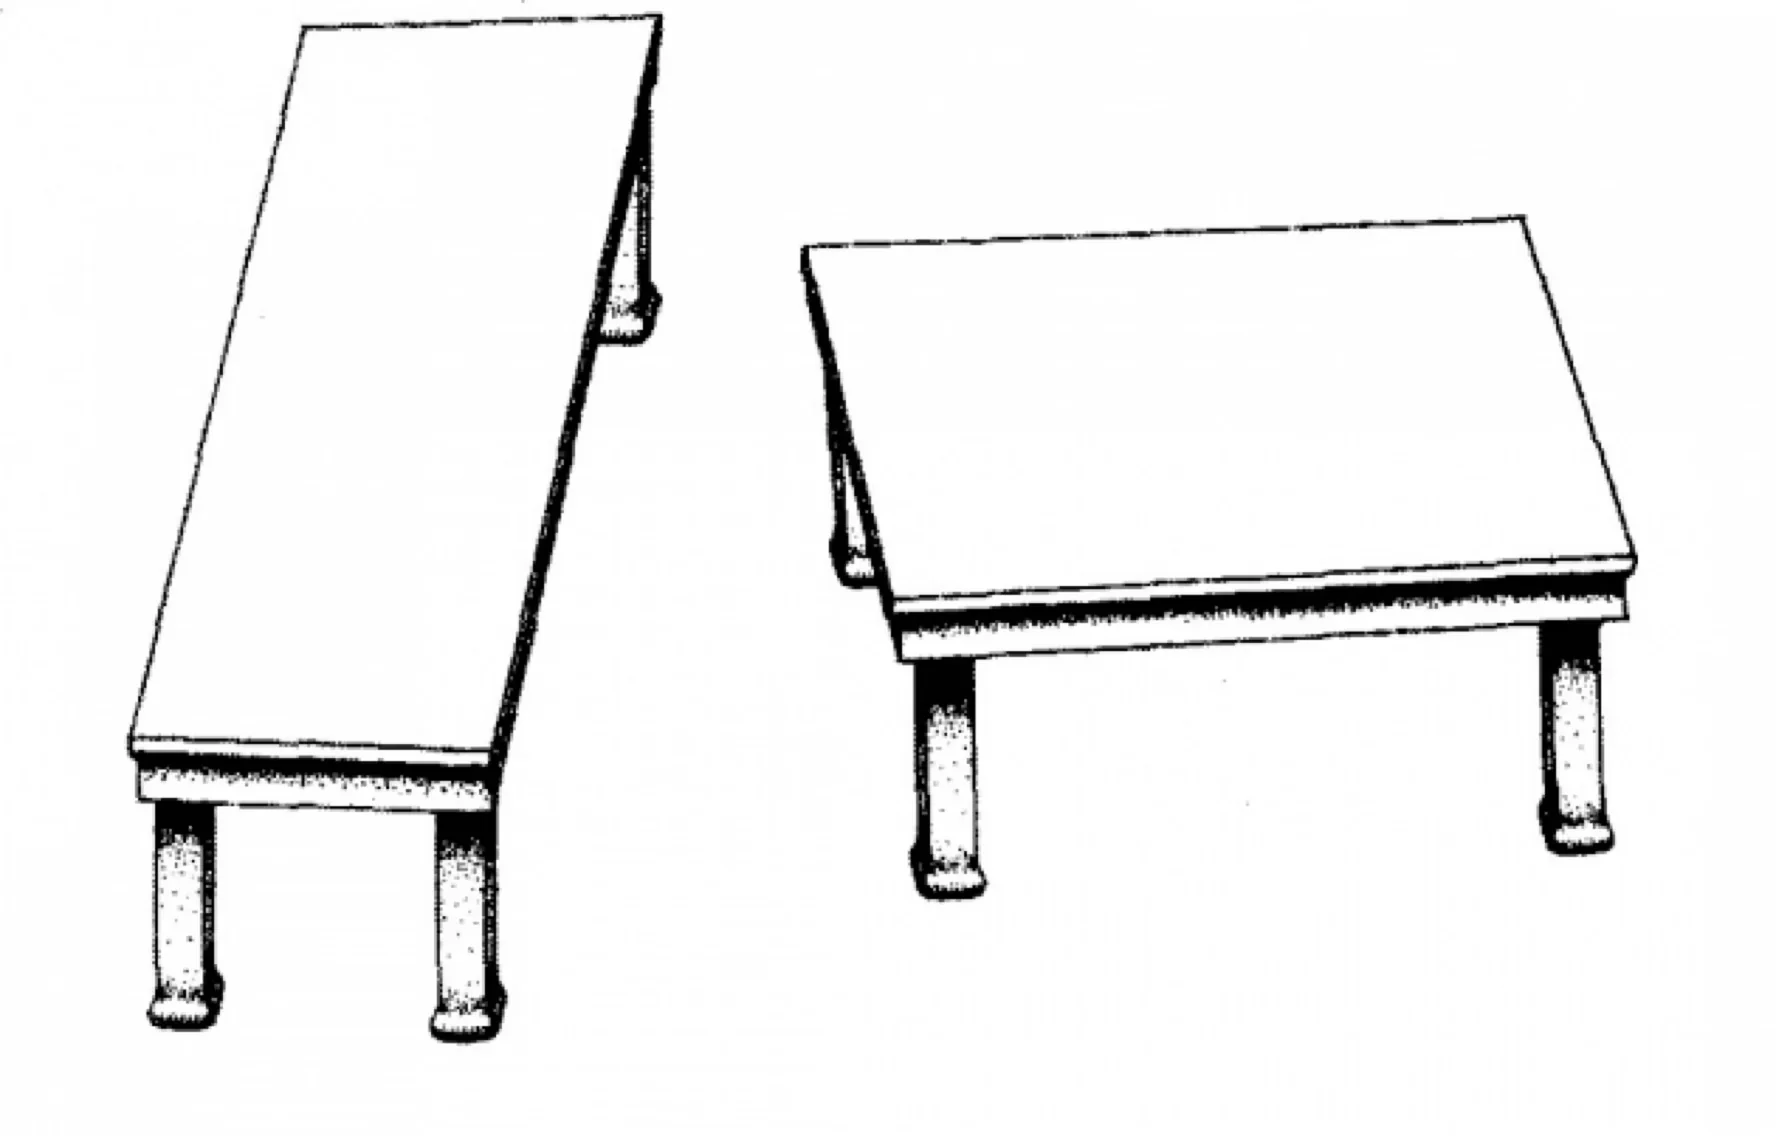
Understand the difference between mathematical and optical alignment. Mathematical centering is based on measurements; optical alignment adjusts elements so they appear centered to the human eye. Sometimes mathematically centered objects look unbalanced because shapes carry different visual weights; optical adjustments are necessary to create pleasing compositions .
Identify situations requiring optical corrections. Icons with asymmetric shapes (e.g., play buttons) often need to be shifted to compensate for their heavier side. Text paired with icons may need vertical alignment tweaks because the baseline of the text differs from the center of the icon.
Apply optical compensation techniques. Move the shape’s center point within its bounding box until it visually aligns with other elements. Increase or decrease the size of circular or curved shapes to match the perceived size of adjacent squares or rectangles. Adjust the brightness of icons or text when colors have different visual weights .
3.2 Visual Weight and Direction
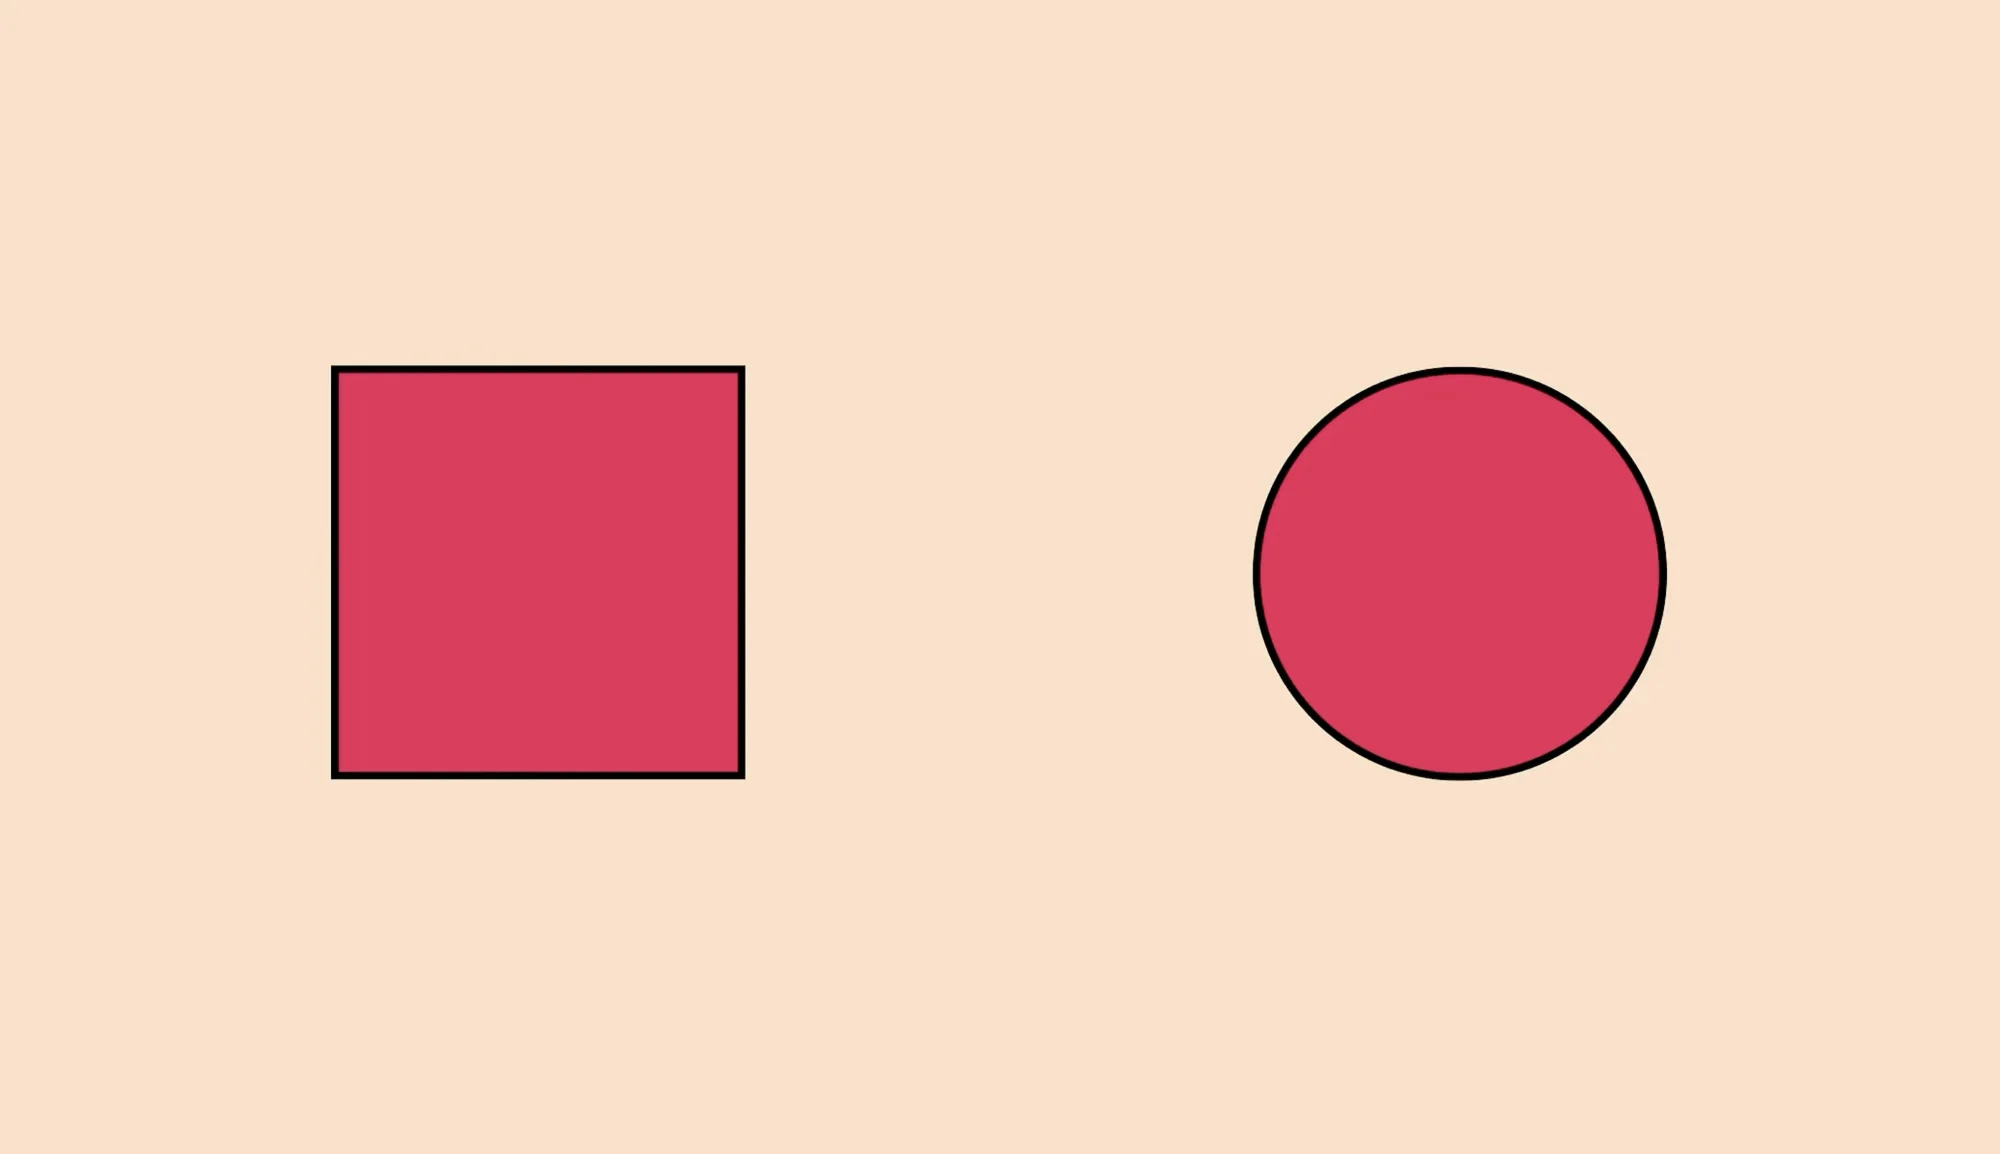
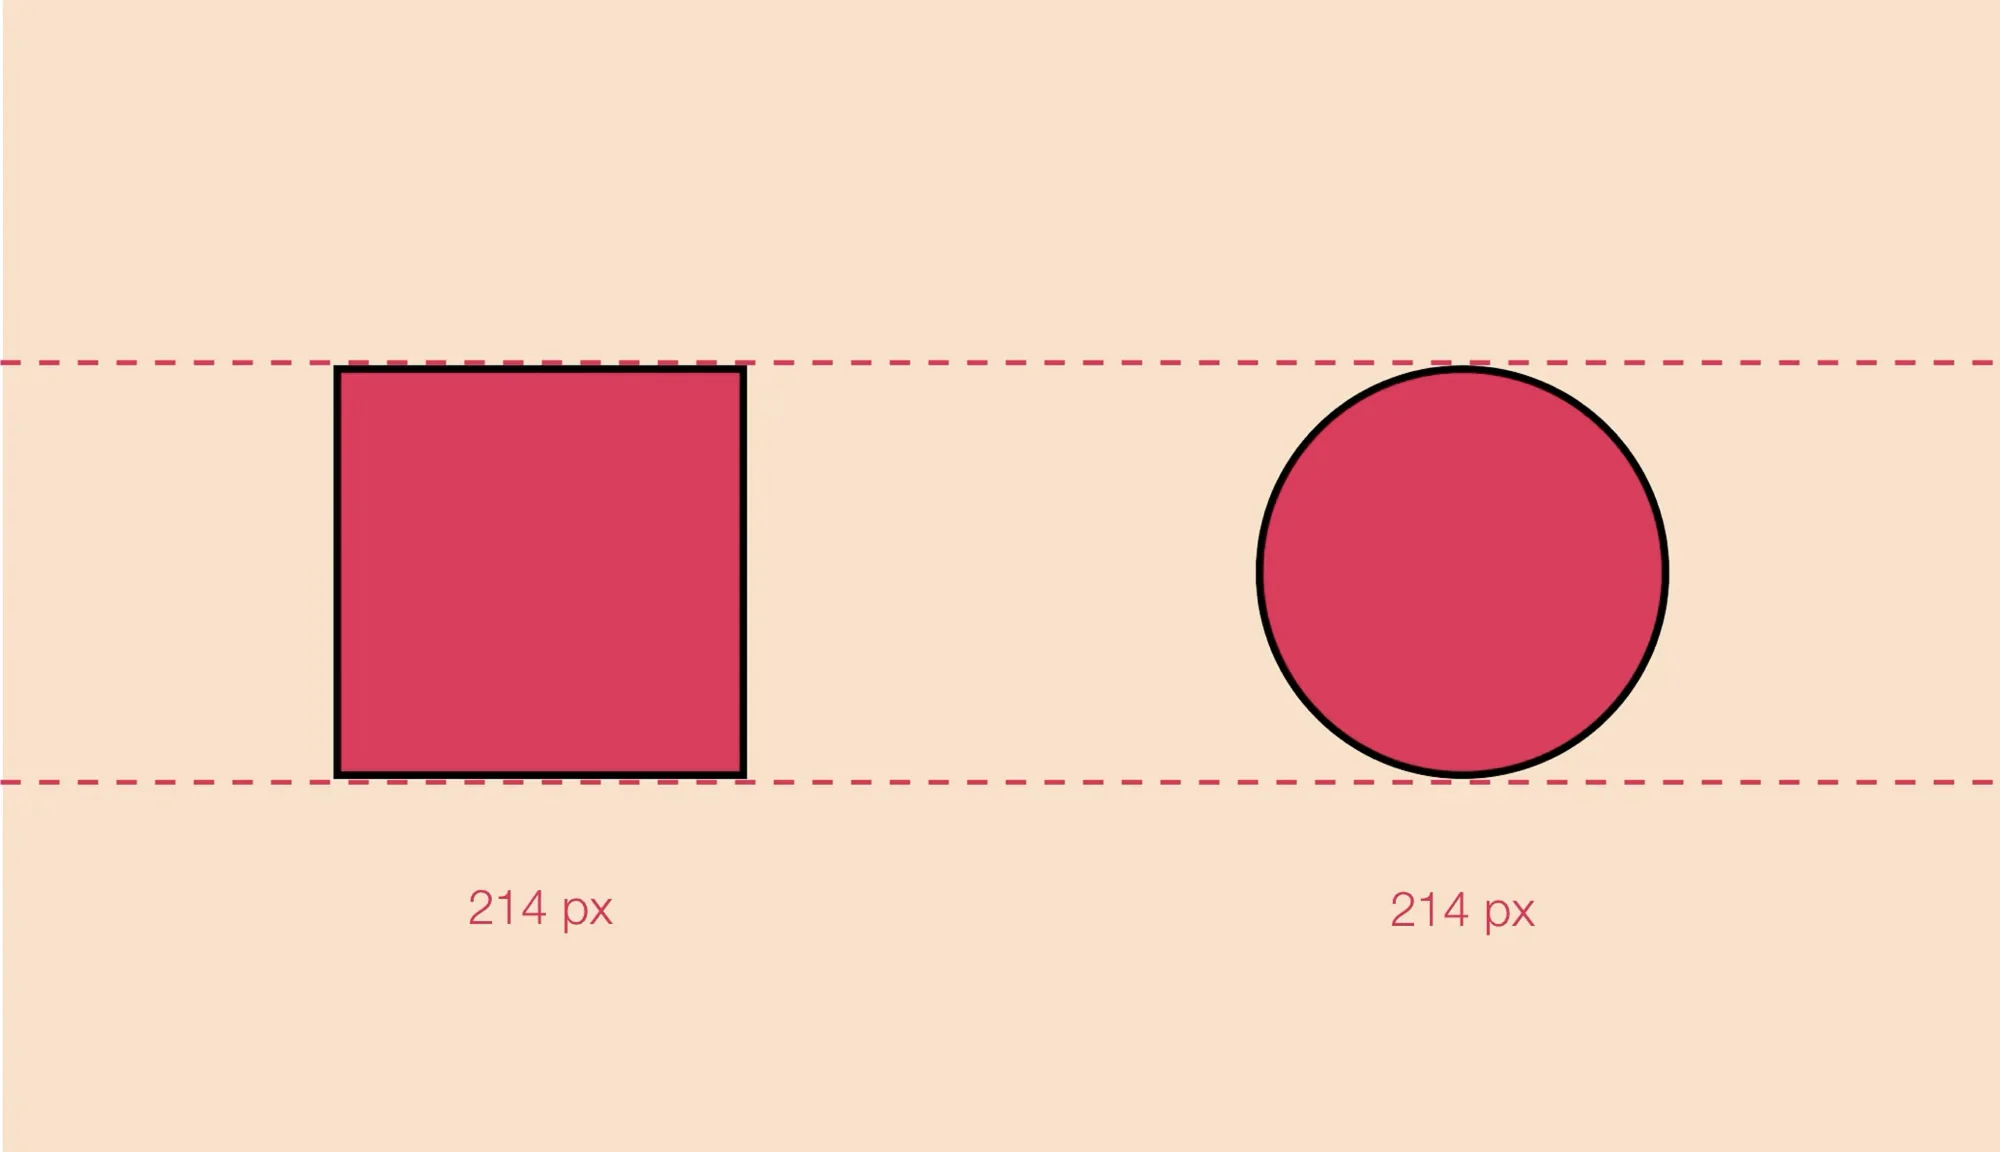
Define visual weight and direction. Visual weight is the perceived force with which an element attracts the eye; visual direction refers to the perceived direction of these forces. A larger, red element has more visual weight than a smaller, blue element. The combination of features like size, color, value, position and shape determines an element’s visual weight.
Use visual weight to create hierarchy and flow. Arrange heavier elements where you want to draw attention and lighter elements where you want to reduce emphasis. Balance the composition by distributing visual weight evenly across the layout. This helps establish rhythm and guides the viewer’s eye through the design.
Trust your eye but test. There is no precise measurement for visual weight. Designers must develop an eye for balance and then validate their intuition with quick tests and feedback.
3.3 Common Visual Illusions in Design
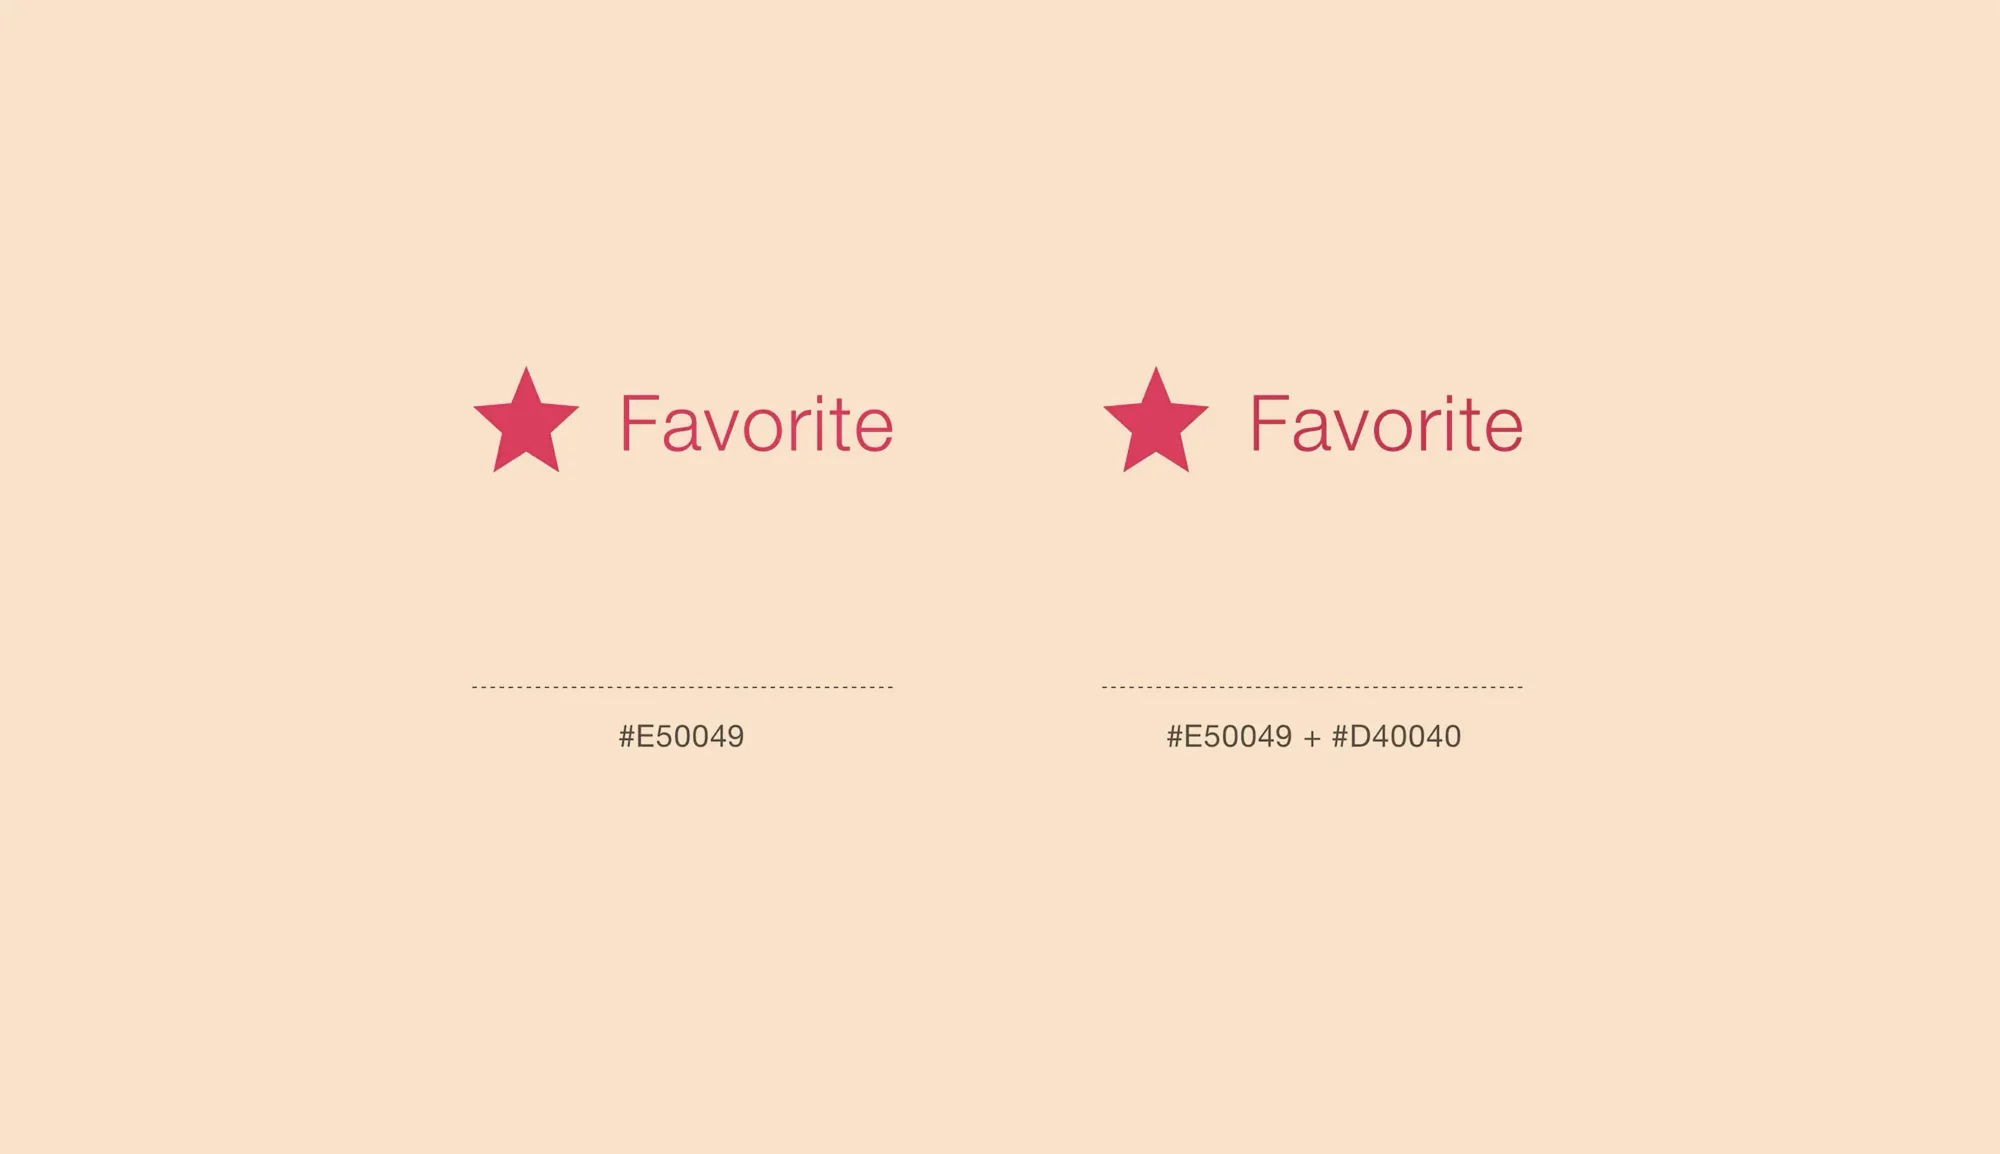
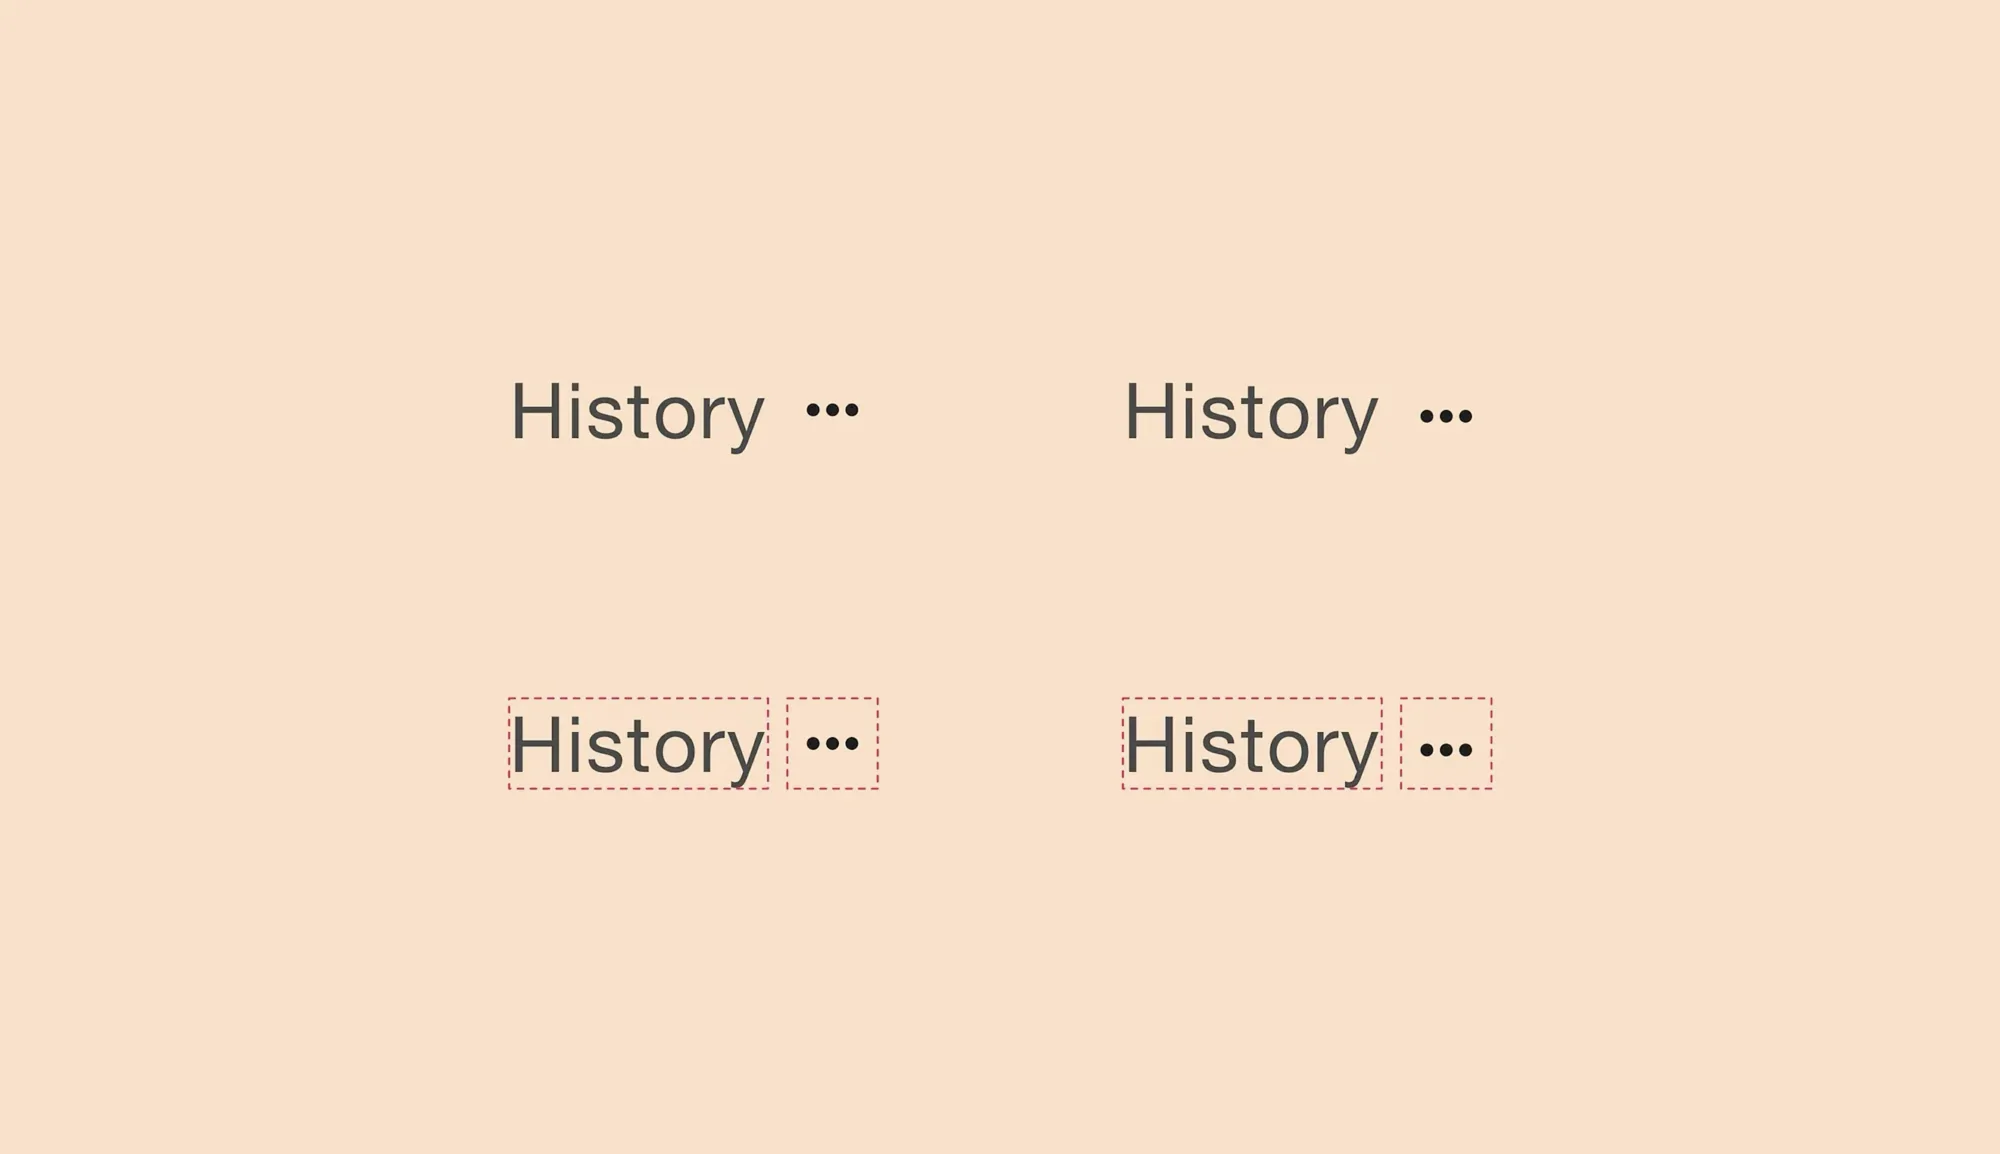
Color brightness and perceived weight. Darker colors often appear heavier than lighter colors. When pairing a small dark element with a larger light element, adjust size or color saturation to balance the weights.
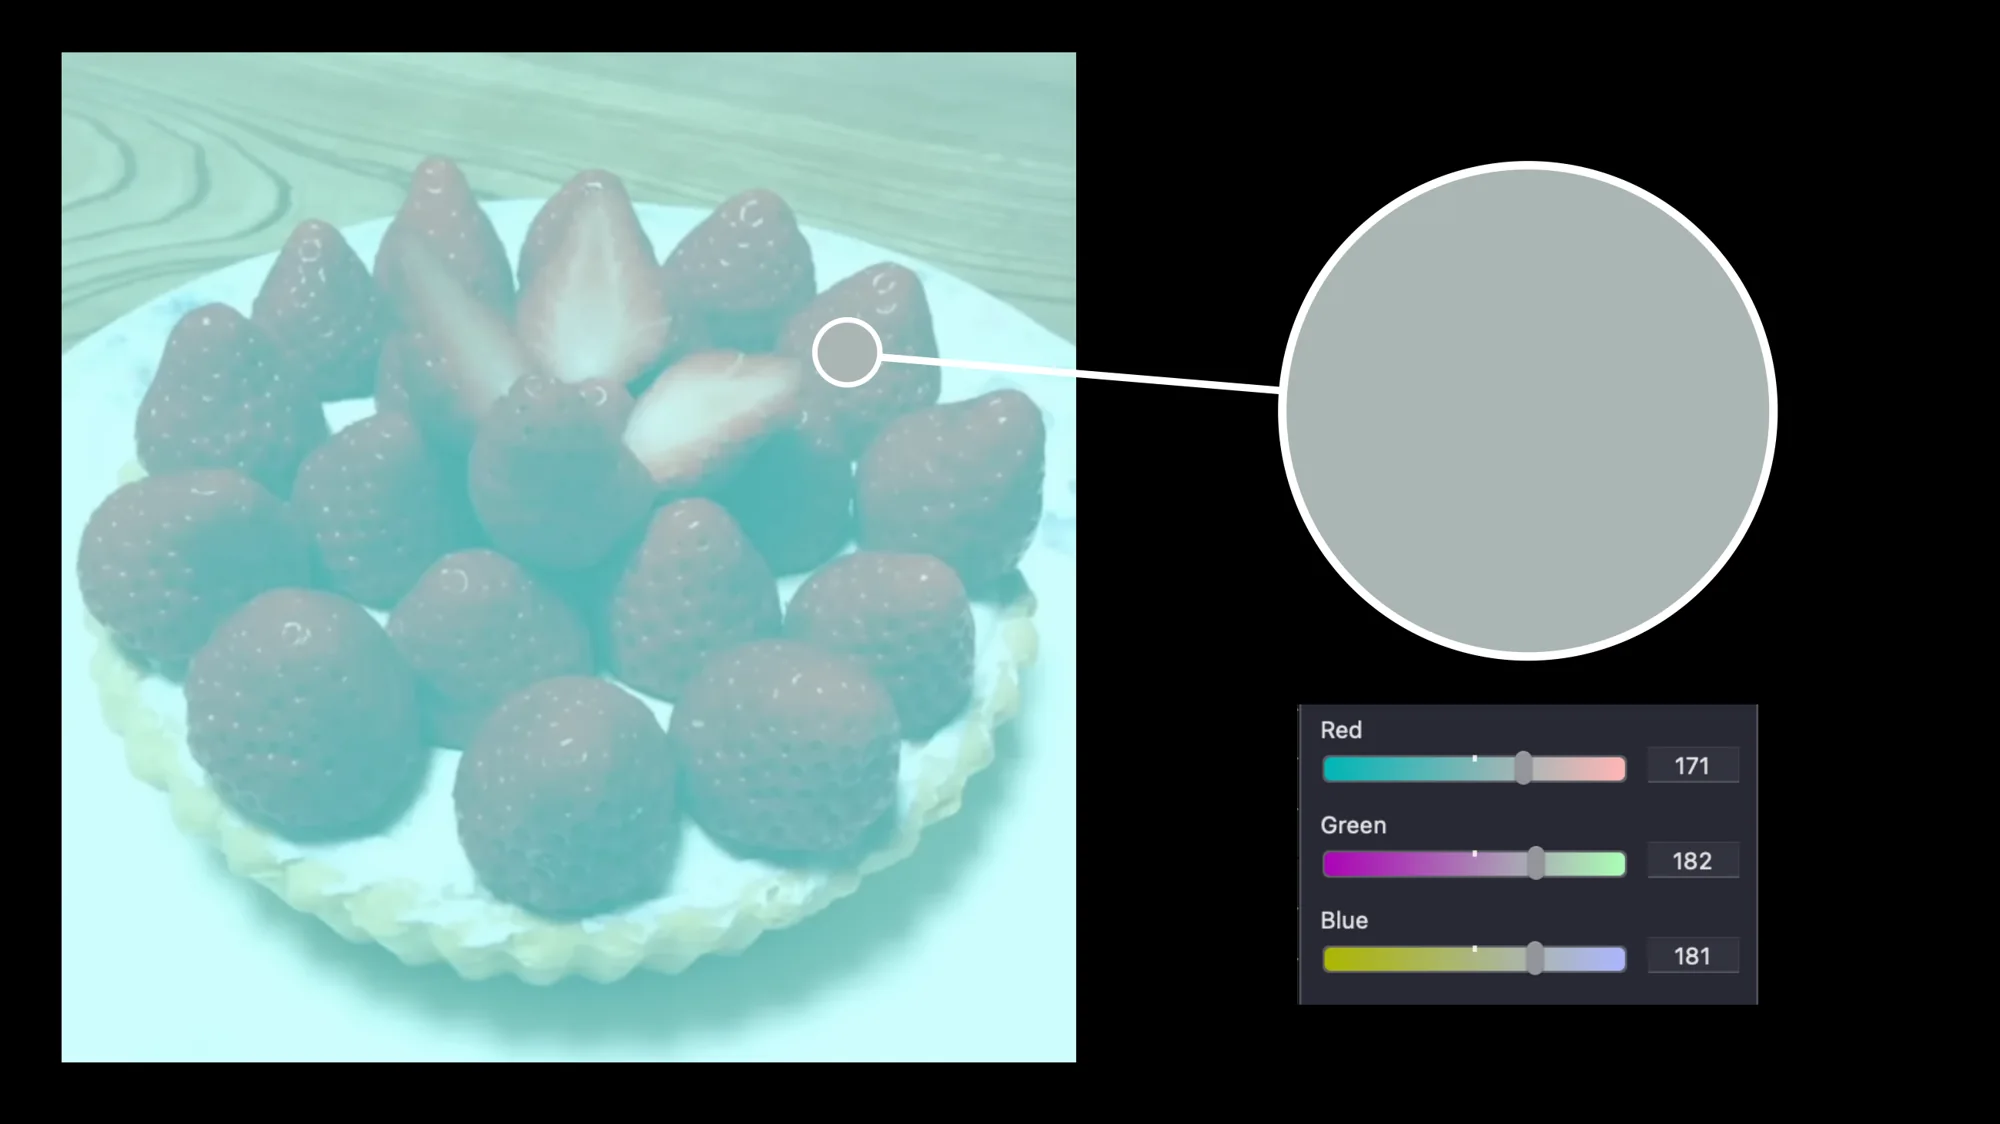
Simultaneous contrast. A color can appear different depending on its surrounding colors. Test your colors on backgrounds similar to the final application and adjust if the hue or value shifts.
Gestalt and figure–ground relationships. The human eye seeks patterns and meaningful shapes. Use contrast and white space to separate figure from ground and avoid ambiguous forms that confuse the viewer.
Readability vs. decoration. Elaborate display typefaces look appealing at large sizes but reduce readability in long passages. Guidelines from the U.S. Web Design System note that serif faces are generally suited to long texts while sans‑serif faces work well for interfaces, and that extended sections of bold, italic or uppercase text decrease readability. Test unusual typographic choices on actual content and adjust if readability suffers.
Over‑reliance on geometric alignment. A composition that is mathematically symmetrical can still feel unbalanced due to optical weight. Nudge elements until the overall balance looks right, even if it breaks the grid.
Module 4 – Balancing Customization and Efficiency
Tailor colors to the logo or brand story. It’s tempting to apply the same color palette across multiple logo concepts, but each mark may have a different personality. Use the quick testing methods above to find colors that fit each design rather than copying colors blindly. don’t be a robot!
Choose typefaces based on context. Serif faces are recommended for lengthy reading and sans‑serifs for interfaces , but this is not a hard rule. If you consider using a display typeface for body text, test its readability on real content and adjust letter spacing or size accordingly. Avoid long stretches of italic, bold or uppercase text because they degrade readability.
Use Pantone and color standards strategically. For identities that will be printed or reproduced in textiles, choose and test Pantone colors early. Pantone provides a universal standard that reduces trial and error and ensures the color remains consistent across materials.
Leverage design systems when appropriate. Using an off‑the‑shelf design system like Material Design or IBM’s Carbon can save time and ensure consistency, but you can customize colors and typography to match your brand. When distinctiveness matters, personalize the design system elements rather than building everything from scratch.
Module 5 – Encouraging Play and Experimentation
Adopt an experimental mindset. According to design experimentation experts, an experimental mindset involves proving yourself wrong as quickly as possible and letting customer behavior guide decisions. Encourage your team to test assumptions rather than defending ideas, and to generate evidence critically .
Design quick and dirty prototypes. Rapid experiments should be simple and low‑fidelity. For example, sketch a layout on paper or create a basic digital mock‑up to test a typeface or color combination. Evaluate the outcome and move on.
Make bold experiments. Design experiments bold enough to fail. Try using a display typeface for body copy, or pair unexpected colors. You may discover a distinctive solution that guidelines would have discouraged. If the experiment fails, you learn quickly and adjust.
Play with rules, then reflect. Know the rules:(contrast ratios, typeface readability, grid systems), then break them deliberately. Record the results, see what worked and what didn’t, and use the insights to inform decisions.
Keep the process enjoyable. A playful atmosphere encourages creativity. Science can be fun, exploring alternatives and celebrating unexpected results fosters innovation.
Module 6 – Putting It All Together
Framework for your session: Start with the why (why test and iterate), then cover methods (quick color and layout tests, iterative assumptions testing), visual nuances (optical corrections, visual weight), customization vs. efficiency, and finish with play and experimentation. Each topic should include examples and mini‑exercises.
Encourage evidence‑based decisions: Use data from tests, contrast checkers and other tools, or analytics to inform choices. opinions and assumptions need to be validated.
Foster a culture of continuous improvement: Show that iterative cycles and rapid experiments should be ongoing. Even after a design is released, continue to gather feedback and refine.
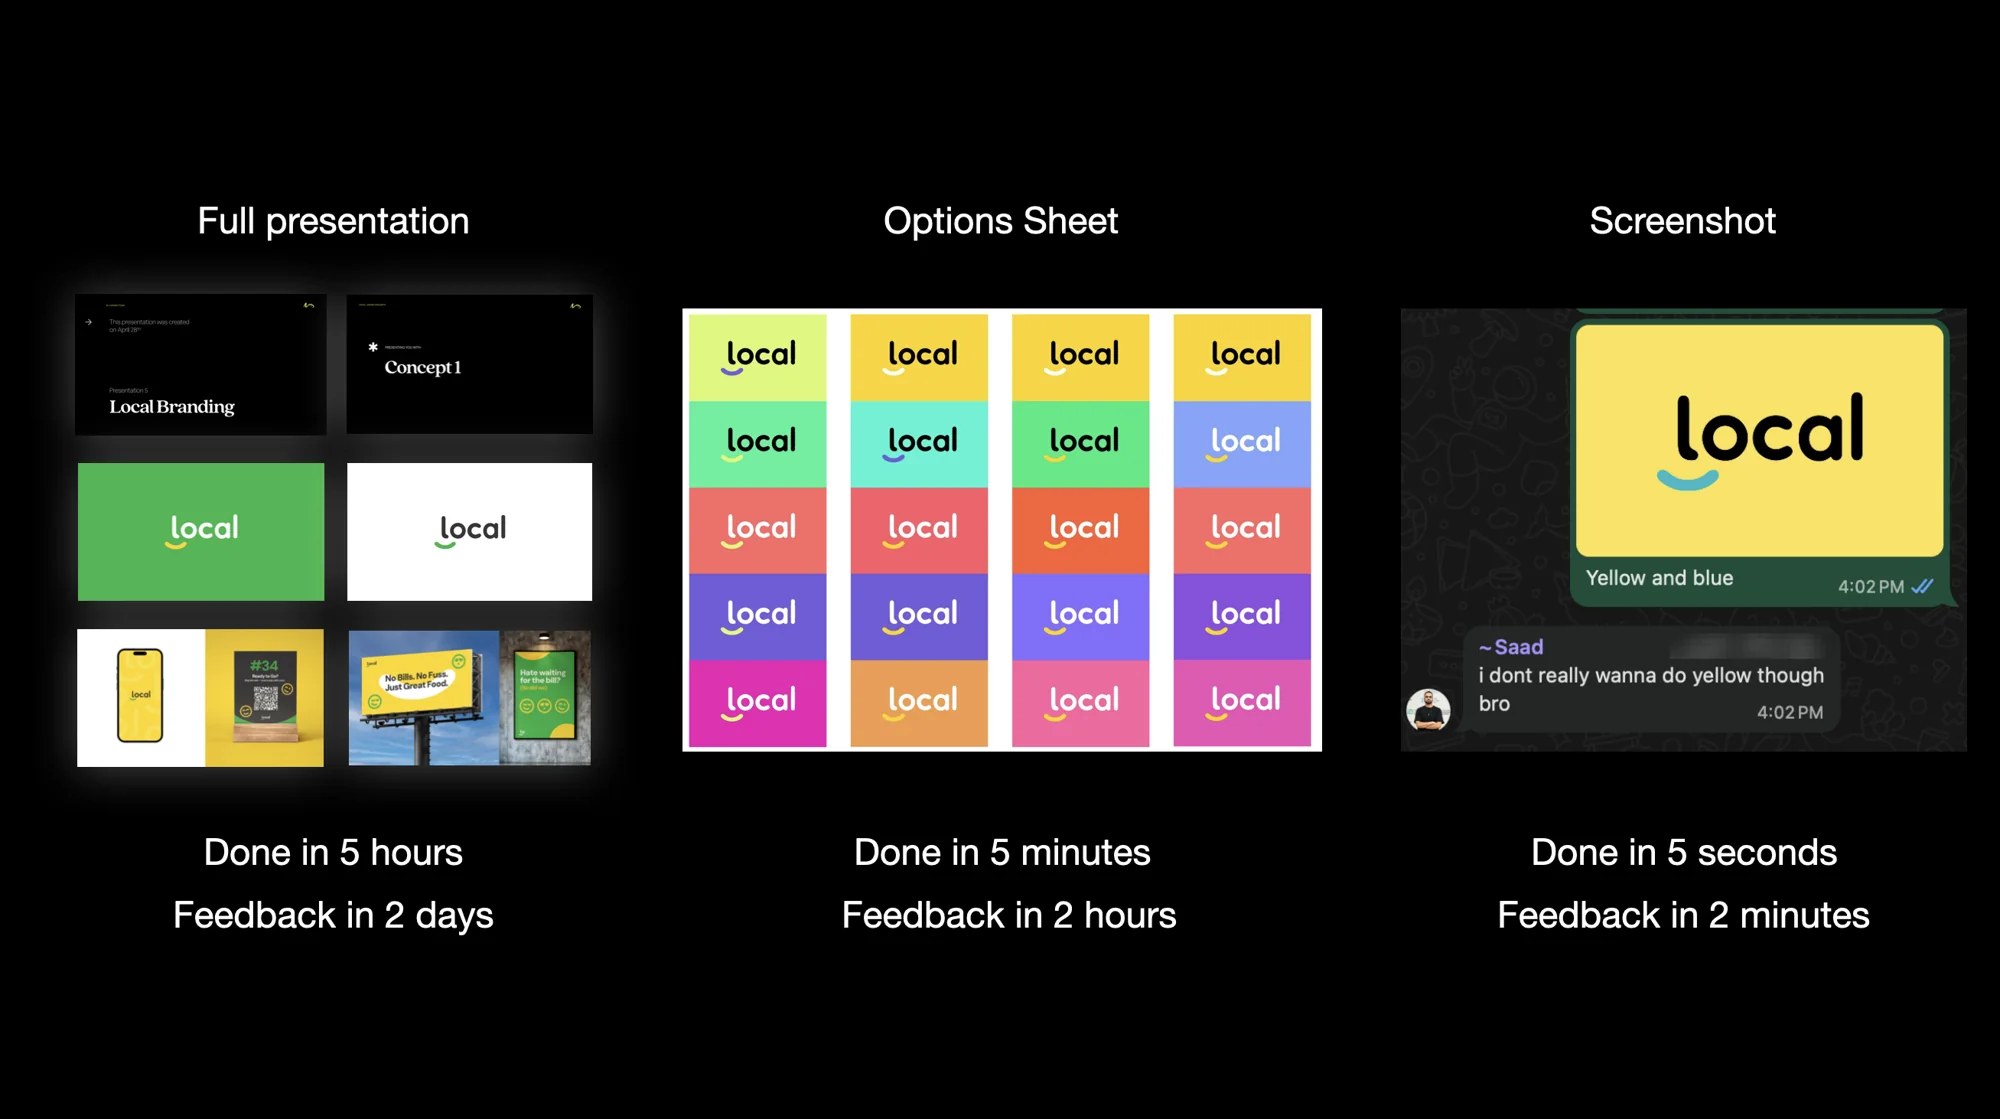
Find the faster way to get feedback: Presentation? Options sheet? or just a screenshot to WhatsApp?
Key Takeaways
Test early and often. Rapid experiments reveal whether assumptions are true, help avoid wasted effort and produce more people‑centered designs. Iterative design is more efficient and reduces the need for costly redesigns.
Use systematic methods. Apply the halves method to converge on optimal positions or color values quickly. Use standard color theory and Pantone to make quick decisions and maintain consistency.
Account for human perception. Optical alignment and visual weight adjustments correct for perceptual differences. Color contrast and readability standards ensure accessibility.
Balance efficiency with creativity. Customize colors and typography for each project instead of rigidly applying the same solutions. Use design systems for efficiency but personalize where it matters
Have fun and experiment. Encourage bold tests and playful exploration while maintaining an evidence‑based mindset.
You are already a scientist! Embrace it!
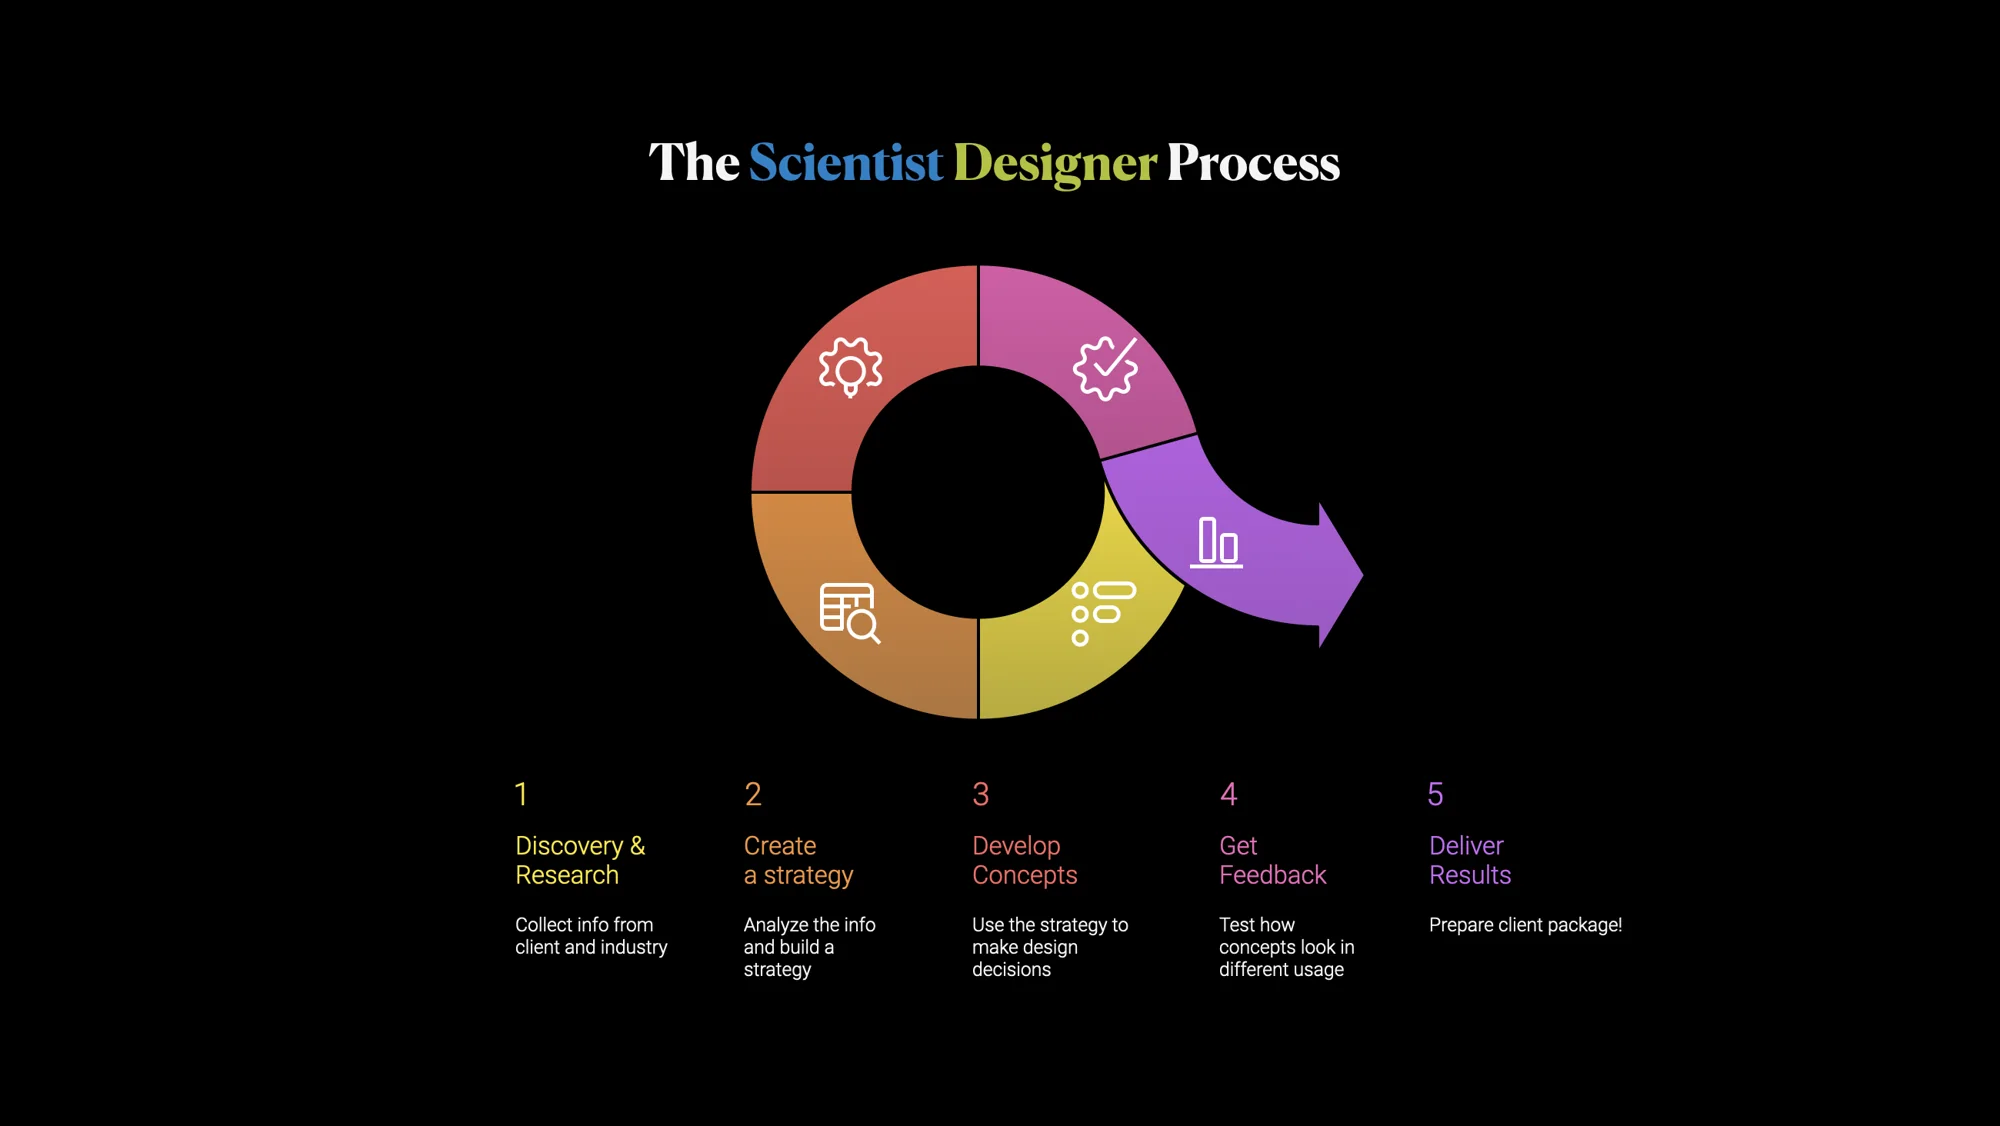
By adopting the Scientist Designer approach, you can build a culture of rapid experimentation, sound decision‑making and creative exploration. This combination of science and play will lead to more compelling, efficient and human‑centered designs.